


WHEN BATCH JOBS DON'T RUN AT THEIR PEAK EFFICIENCY, it's sometimes difficult to diagnose exactly what is causing the problem. We've spent a considerable amount of money on hardware that is capable of doing the job, but are we using our resources as efficiently as possible? Several different types of detailed analysis need to be done in order to find opportunities to improve the performance of your batch p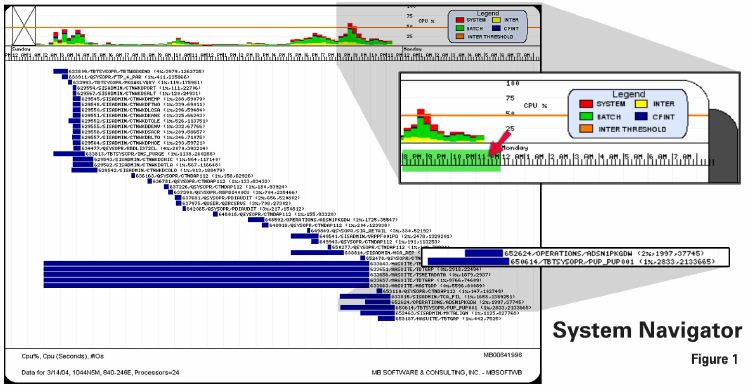 rocesses.
Job-level Bottlenecks
The top priority is to find the job-level bottleneck. If we're going to analyze the performance of batch processing we've got to understand specifically what we're referring to. (Figure 1) In this example we have a 24-way system running at less than 10 percent of its capacity during the day, and barely at half of its capacity at night - there is tons of batch horsepower here that ought to be capable of getting this processing done quicker. Yet one of these jobs (PUP_PUP001) is running for three hours. From 8 pm until 11 pm, the system was less than 50 percent used. Why was this job running so long when there was so much resource available? This is the first thing we need to understand.
After we've identified the job-level bottleneck, we need to understand what's causing the slow-down. Is the job CPU-bound? Memory-bound? I/O-bound? Everything is as slow as its weakest link. In our example, the job is probably not CPU-bound - it's only averaging on percent of a 24-way. Yet it's taking three hours to complete. The reason - this job is I/O bound. It's responsible for over 2 million physical I/Os throughout its duration. The job above it (ADSN1PKGDW) got done far quicker because it did less physical I/O and was able to use the CPU more efficiently. I'd still ask myself why it ran for an hour and a half; it's probably still I/O-bound or CPU-bound, but it's running better than our example.
This example (Figure 2) is typical - most of the slow jobs we find are I/O-bound. They're reading a million records to select a thousand records. This causes slow batch jobs, poor interactive response time, high disk actuator arm activity, and high CPU use. If that same job only read a thousand records to select a thousand, it would have consumed that much less CPU, that much less memory, and the job would have been done quicker. In this example, 19 percent o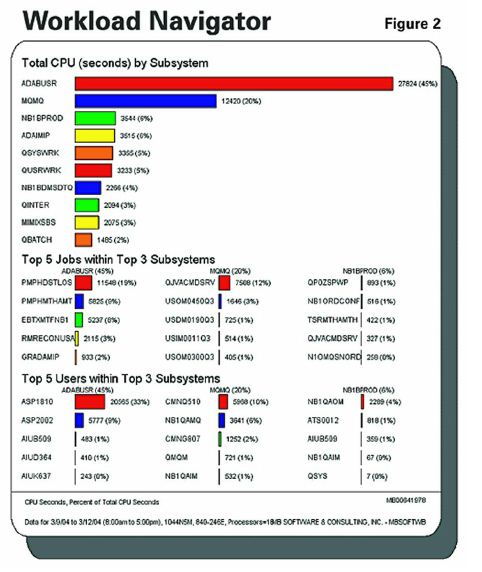 f all CPU on the system is consumed by one batch job (PMPHDSTLOS). Compared to everything else that's running on the system, it's a bottleneck, and it's critical that we know where that bottleneck is. We want to know that if we reduce the I/O, we're going to solve the problem.
Resources Consumed by Program
When looking at the consumption of resources, don't stop at the job level. Whenever we have any type of batch job issue, looking at the consumption down at other levels can provide good insight as to what's going on.
First of all, is the batch job truly a 'job' or is it a 'job stream?' An example of a job might be one program calling out to a number of other programs, but it's still one process (invoicing, for example.) A job stream, on the other hand, is a sequence of events. It may be a CL program that calls 50 RPG and COBOL programs sequentially. It may be 50 or 100 different jobs that run sequentially, and comprise your entire nightly or month-end process.
At the operating system level, look at things like QDBGETKY versus QDBGETSQ. These are the operating system programs that are retrieving data randomly, while QDBGETSQ is retrieving data sequentially. If we see a job that's spending 90 percent of its time sequentially reading data and only 10 percent of its time randomly retrieving data or updating data, it's an indication that that job has a problem. It's going out and sequentially reading files from top to bottom, checking every record to see if it's the one you need to process. In some cases, QDBGETSQ will read through seven years' worth of history to get to the open transactions that need to be processed. QDBGETKY, on the other hand, will randomly position to the data that it needs, read it, and be done with it in a fraction of the time.
Here's an example (Figure 3) of an operating system level analysis over a daily job. In this example, 33 percent of the duration of this job is spent in QDBGETKY, doing random reads. QDBPUT, where the writing of records takes place, accounts for 45 percent of the duration. That's a pretty efficient example. On the other hand, the numbers could be reversed. If 45 percent of the duration was reading data 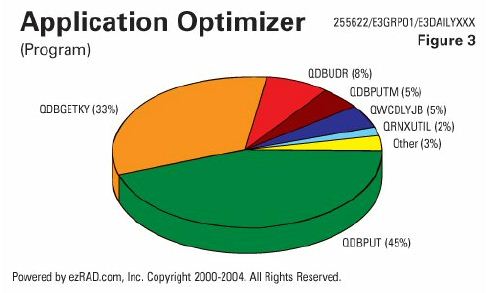 sequentially with QDBGETSQ, and 33 percent of the time was spent in QQQIMPLE running queries (possibly without the proper permanent access paths), we could have a problem.
Next, we've got to know what kind of problem we're trying to solve. Are we trying to solve a CPU capacity issue? Are we trying to solve an I/O bottleneck? Is there memory faulting occurring? Is it purely an elapse time issue, where the job is simply running too long? Typically we find that the answer to the problem is not the first one that comes to mind - it's not the invoice routine that needs to be changed or rewritten to be more efficient, it's the routines that are being called out to. It's the old date routine that was written 15 years ago and does a SETON LR at the end. It's a handy routine that's reusable throughout the application, but now it's called for every line item inside of your nightly process, it's the problem. The things that should be insignificant are actually responsible for the biggest part of resource consumption.
For example, take a tax calculation routine. This is a great example of an old program written years ago. It accepts parameters to determine what to calculate, opens a bunch of files, quickly calculates tax, closes all those files and then returns to the calling program. At one time, it was a good, reusable routine. However, now that it's called for every line item (maybe multiple times), that old routine is not very efficient. Whether a tax calculation routine or a date routine, if there's any form of high initiation and termination - whether that's starting and stopping jobs, opening and closing files, loading programs in and out of memory, or SQL constantly initiating and terminating connections - it creates unnecessary overhead. We need to minimize that initiation and termination by opening files once in the beginning, leaving them open for the entire duration of the job (or for the whole day, if it's a batch job that's never-ending), and use record pointers to find data.
I/O by Database File Name
Having looked at our programs, let's see what we can do with the database to get things to be more efficient. First of all, let's compare the percent of reads to the percent of writes and updates. If we have 90 percent of the I/O as reads and only 10 percent as writes, that's an indication of a job that's not reading data very effectively. As mentioned earlier, inefficient data reading is the top performance issue 9 out of 10 times. Whether in RPG, COBOL, or SQL, writing and updating is quick and easy; reading and filtering through all of those records is what makes the job run so long.
Examine the number of I/Os versus the records in the file. Doing a million I/Os over a file that has 300 records in it isn't very efficient. There are a few ways to rectify this problem. If you have the code and can modify it, load the 300 records into an internal array. If you don't want to do modifications or don't have the source code, there's an operating system command called Set Object Access (SETOBJACC) that will pin a file into memory - that way, when the I/Os occur, they are more likely to be logical rather than physical.
Even if there are small I/O counts on files, those files can still bog down your system by constantly opening and closing. If there are only 10 I/Os against a file, but your job opened the file, did 10 I/Os, closed the file, reopened it, did the I/Os, closed the file...you can see how much time is wasted. Simply leaving those files open could take a 6-hour batch job down to 20 minutes.
From our analysis of the I/O by database file, we may determine that it's time to purge or move some data. One example would be a General Ledger transaction history file that's being queried constantly at the end of the month before your month-end can run. The jobs are constantly querying a file that has several years worth of history in it, but the users are just looking for this months data - the open or the recently closed transactions. Why have that old historical data in the file? You don't necessarily have to purge the old data; just get it out of the file that's being queried constantly and into another file. Even if you move all six months' worth of data, it's a far smaller set to query than the entire history.
We want to make sure that any database I/O occurs through proper indexes, or proper logical views. In RPG, this would mean doing a Set Lower Limits (SETLL) or a CHAIN. In SQL, queries should use existing permanent logical files to access data, instead of building a temporary view from scratch, or doing full table scans. We want to keep the I/O to a minimum by using the proper logical views. Many times, you don't need source code - if you provide the proper indexes, then the SQL will automatically use them through the OS/400 query optimizer.
In this example (Figure 4), the ORDERDTL file is responsible for 50 percent of the reads, the ORDERHDR does 20 percent, and the CUSTMAST does 10 percent. All of these are inputs - tim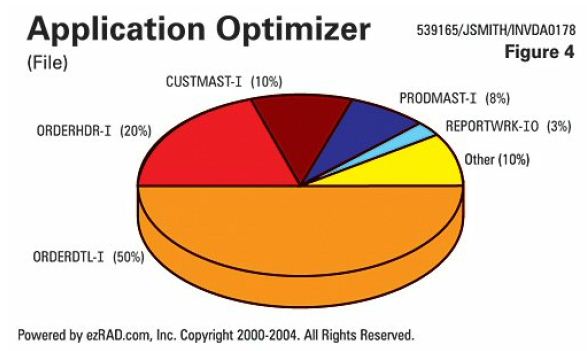 e spent finding data. Writing the data to a work file, sorting it, then generating the actual report only accounts for 3 percent of total I/O. Proper indexing and accessing of the data would have accomplished this task in a fraction of the time.
Delays caused by Object Locks
From a developer's standpoint, it's easy to forget to put the work files you've built into QTEMP. But object lock on work files that were accidentally left in a permanent library can cause major processing and scheduling issues within your nightly job streams. Or jobs might have to be single threaded throughout the day because of a work file that really should've been in QTEMP. A very simple fix to some of these batch job issues is to get those work files into QTEMP - either by requesting the changes from your vendor or making them in-house.
Separate data libraries per location, warehouse, facility or region may be helpful in dealing with object locks as well. Depending on the number of facilities you have, it might make sense to multi-thread the facility processing and eliminate the object lock issue that way. Oftentimes, there is a fear of multi-threading; there's a sense that at night, only one job should be running at a time to prevent object and record locks. But this fear is essentially ungrounded. We have to keep in mind that there are hundreds of jobs simultaneously during the day - hundreds of interactive sessions, hundreds of batch jobs. If a hundred jobs can run simultaneously during the day, why can't a hundred jobs run simultaneously at night, accessing the same files? Object locks are not as big of an issue as they're often perceived to be. If they are an issue, they can be fairly easily addressed within the application. And the improvement to the performance of batch processing is substantial; if you're single-threading many jobs one right after the other, it's going to take a lot longer. Your CPU is going to be used at 3 percent of its capacity for the whole duration. On the other hand, if you were to multi-thread that processing, the CPU would actually get a chance to be used to its potential - and things would get done in a fraction of the time. It is important to remember though, that if the job is in an object lock wait status (LCKW) for a long period, it's bad. Thousands of short lock waits all added together could be a big issue as well.
Technique is what it's really all about. Here's a simple example: if someone's using a Create Duplicate Object (CRTDUPOBJ) command to copy an object into QTEMP, they are going to create an object lock. But if they use a Copy File (CPYF) command with the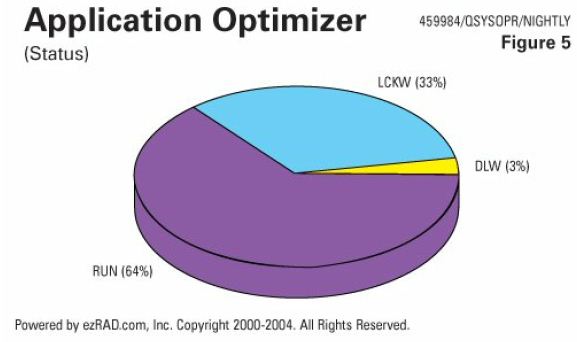 CRTFILE(*YES) parameter to get the object into QTEMP, they are accomplishing the same thing without the object lock. Older code is much more prone to locking issues. back in mainframe environments, we typically allocated everything exclusively, did our thing, then released it. Some of that got carried over into the iSeries and AS/400 world, but we find these days that it's really just not necessary.
Here's an example (Figure 5) of a nightly job stream experiencing serious locking issues. In this job, 33 percent of the time is in a lock wait status (LCKW), 3 percent in a delay wait status (DLYW) and 64 percent in a run status (RUN). Let's get rid of the lock and get that job done a whole lot quicker.
This chart (Figure 6) shows that same locking issue by object name. The last available account number data area (ACCTDTAATA) comprises 19 percent of the duration of the job. The region work file (REGIONWRK) accounts for another 14 percent of the duration, and is a file that ought to be in QTEMP. So, even though there was 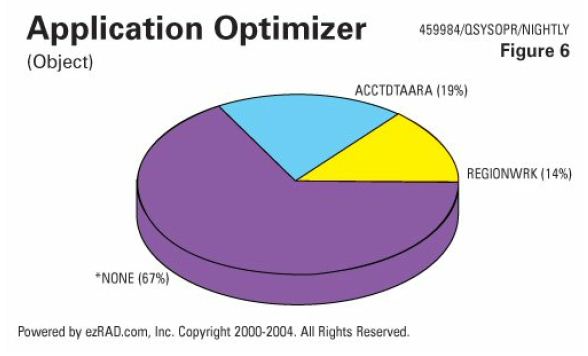 no object lock 67 percent of the time, this job is running a third longer than it needs to be.
Heaviest Active Job Function Names
Next, we want to look at active job function names. Do we see jobs going in and out of short Delay Job (DLYJOB) commands? You see this occasionally, where a job is doing a DLYJOB of 3 seconds after it processes each record. Even though there are a couple of reasons why someone might do this, the amount of time that accumulates because of those 3 second delays can cause huge job duration issues. Is the operating system rebuilding access paths (IDX - and a file name)? Is there other copy filing of data? A good example is a CL program that does a CPYF into QTEMP with selection criteria. The report program then selects the sorted data from the work file in QTEMP. Although the coding is easy, copy filing data with selection criteria is probably one of the most efficient ways possible to get data into QTEMP from a large file.
Instead, us an Open Query File (OPNQRYF) command with the proper index and a Copy Form Query File (CPYFRMQRYF) command. Writing two line of code instead of one doesn't complicate things that much, but it does get the job done in a fraction of the I/O, CPU, memory and disk activity. The reason is because it's actually using an index to get the subset of records, while a CPYF is going to do a full table scan.
Here's just an example (Figure 7). Only 25 percent of the time was spent actually processing the data. Indexing the GLHIST file took 49 percent of the duration, doing a CPYF took 11 percent, and 15 percent was spent in a DLY wait. All of these things co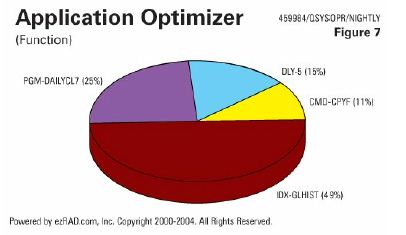 uld have been done in a minute or two. Why are we doing any delays? Why are we copying files with selection criteria? Why are we letting the operating system rebuild access paths over 7 years' worth of General Ledger transaction history?
Record Lock Contention
As with object locks, there's a fear of record locks occurring during nightly or batch processing. We're single-threading everything because a record lock could occur. Again, hundreds of users simultaneously access that Customer Master all day long - there shouldn't be a bigger fear of record locks at night. This can be dealt with. There are tools out there that will automatically notify you of a record lock and automatically retry, should a lock occur. You shouldn't allow your batch processing to take 7 hours when it could be done in an hour and a half, because of fear of record locks. We want to monitor the time that's being spent on lock waits and see if that's really what's causing the problem. We really want to dig into the data and see at the operating system, application, and database levels what's really causing the problems and then spend our time addressing those issues.
Here's an example (Figure 8) of elapsed time spent on specific record locks. Here we have 12 percent of the time spent on the Customer Master record locks, and another 16 percent spent on the Product Master, Terms Codes, and Tax Master. Many parts of yo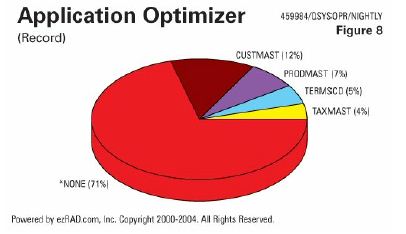 ur processing all go after the same records, so there could be record lock contention there. But if you understand that, and determine that you could cut the duration of this job by 29-30 percent by dealing with this record lock issue, it might be worth your effort.
Time Spent on Job Status
How much time does a job spend in a specific job status? Do we have a never-ending job that's always in a RUN status? If so, we have a problem. Never-ending jobs should be waiting on a data queue (DEQW), or on a time wait (TIMW). Jobs that start at IPL time and run all week interfacing data between systems should never be in an always-running status. If they are, they're always consuming resource, even when there's no activity. That's an indication of a job that just isn't using proper performance techniques for interfacing or processing data. It's probably reading your Order Detail file from top to bottom in a constant loop, checking every record to see if it's in the right order status to send it over to another system or to trigger some type of event. That's inefficient! Let's use the triggers, data queues, journaling, and other techniques to accomplish the same thing, but with less resource. As a developer, you might need to familiarize yourself with these various techniques, but once you learn how to use them, your batch jobs will become much more efficient.
On the other side of the coin, do we have a nightly job that's not always in a run status? Do we have it going into a delay wait (DLYW), an event wait (EVTW), or a lock wait (LCKW) status? If this nightly job were always in a RUN status, it would get done in a fraction of the time. The Delay Job (DLYJOB) command is occasionally used within a process, but is a bad technique. We often find that the waiting and checking is the thing that's causing the job to run long and causing all the resources to be consumed. Instead, a data queue or a trigger should be implemented to have the job consume resource only when there's really something to do.
Do we have a DEQW that never waits? The whole purpose of the data queue is to wait, consume no resource, until there's something to the process. So, doing any call to QRCVDTAQ with a wait time parameter of 0 almost completely negates the value of using a data queue.
Let's see how much time your job spends on a message wait (MSGW), especially if it's nightly, weekend or month-end processing. Do we see these message waits occurring that must be responded to constantly with 'Ignore' or 'Retry'? For that matter, how long is it before an operator even notices or responds to the messages?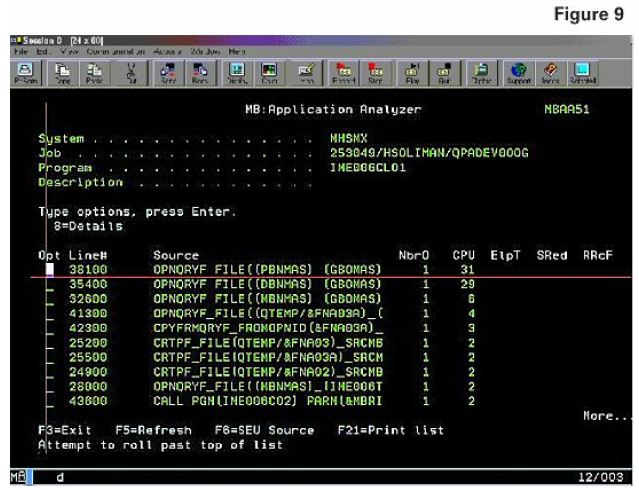
CPU by Line of Source Code
If you have the source code for your purchased application, or if it's in-house code, looking at CPU by line of code can be a great way to understand what's going on in your top resource-consuming programs. For example, is there a bad line of code that sets on LR at the end of a date routine? Are there user-controlled opens and closes on 50 files for each line item? Is there a CHAIN to the Customer Master file for every line item? It's one order, there's one customer for the whole order. Chaining out to the Customer Master for every line item or out to other files for every line item should be done once, and then only if the customer number has changed. Simple 'IF' logic in the code can significantly reduce the I/O.
If you have a CL program running Open Query File (OPNQRYF) commands, is 73 percent of the CPU and elapsed time spent in those commands? Is a call to a tax calculation routine responsible for 85 percent of the elapsed time? These are very typical examples that we find when we do this type of analysis.
Here is a good example (Figure 9). In this job, 31 percent of the CPU consumed was consumed on the first line of code, which is an OPNQRYF. Very quickly, when you're looking at CPU by line of source code, you can see what's consuming the resource. It doesn't matter what kind of code it is - CL, RPG, COBOL, Java, or ILE C - when you see the code sorted descending by CPU, you can very quickly come up with some creative ideas as how those lines of code can get done quicker or be replaced with more efficient lines of code.
Duration of ILE Modules, Elapsed Time by ILE Procedure Name
If you're dealing with a complex ILE-bound program with 50 modules in it, often the problem isn't at all what you think it is - it's not the main core routines, it's those external things - those date routines, those format routines, whatever they might be. We want to identify the source of the problem within the operating system and code so we can focus our energy appropriately.
Here's another example (Figure 10) of routines that should be insignificant, but are actually the most significan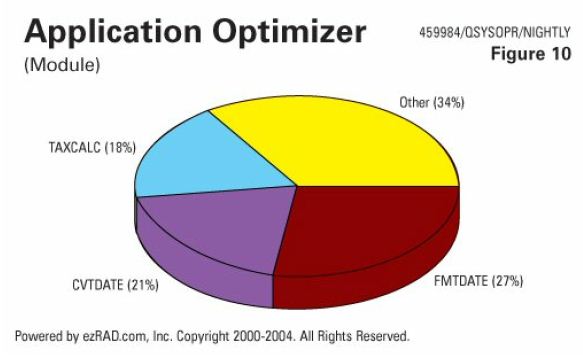 t part of the resource consumed.
There may not be one bad line of code after all, but there may be a bad subroutine. The subroutine is going back out and re-summarizing monthly sales totals across a detailed sales file. For example, you might want to summarize the sales totals for one region. Is the data pre-summarized so that this program can do a simple lookup, or does your program have to summarize massive amounts of data across all regions to get the small data set you need? Focus on finding a better way to have those subroutines perform, or replace them with more efficient ones.
We also want to minimize the calls to intensive routines, and pinpoint the sections in the code that need rework. Here's an example (Figure 11) of a 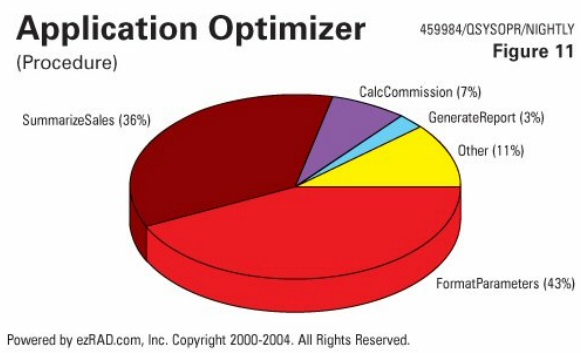 FormatParameters procedure - which is simply the manipulation of parameters coming into the program - accounting for 43 percent of the duration of the job. The startup code, the stuff that should have been quick, is actually the biggest part of the process. The summarizing of sales data, the calculating of commissions and the generating of the report - the real work that needs to be done - is actually the smallest part of the process.
Conclusion
Hardware is becoming more compact, and does more work faster than ever. We spend vast amounts of money keeping it up to date, demanding that more power come in a smaller package. Yet, some of our applications are decidedly cluttered and inefficient. You wouldn't try running your company on hardware from 1989, so why is code of the same vintage still floating about in your system? Cutting the fat from those old routines will greatly increase the efficiency of your applications, and you'll finally see the performance you expect from your system.